Visualization
Introduction
The results of μfem simulations can be exported to VTK files for further
inspection and visualization in an external post-processor.
The export can be made using the mufem.FieldExporter class: it takes any
field available through the
CoefficientManager and writes it to
a VTK data collection.
Two post-processors are commonly used with μfem output:
- mufem-Scenes — μfem's own post-processor. Runs directly in the browser; no installation required.
- ParaView — the general-purpose VTK post-processor. Recommended when you need its advanced filters, scripting, or are already familiar with it.
A typical workflow is:
- Get the exporter from the simulation.
- Register the fields you want to export with
add_field_output(). - (Optional) Configure the output order, directory, and event triggers.
- Call
save()manually, or let configured triggers drive saves automatically during the run.
The output is a .vtpc.series data collection that both post-processors
can open directly.
Field Exporter
Getting the exporter
Each simulation owns a single FieldExporter instance, retrieved with:
Adding fields
Register any field available through the CoefficientManager by name:
field_exporter.add_field_output("Cell Volume")
field_exporter.add_field_output("Position")
field_exporter.add_field_output("Electric Field")
add_field_output() only registers the field — nothing is written until
save() runs (manually or through a trigger).
Output order
The output order controls how finely each field is sampled when written. The default is order 1.
Increase it with:
For high-order fields, set the output order to match (or exceed) the field's finite-element order — a lower output order undersamples the field within each cell. For first-order fields, increasing the order simply subdivides each cell for smoother rendering at the cost of larger output files.
The same order can also be supplied per call to save() (see below).
Output directory
By default the output is written to the VisualizationOutput/ folder in the
current working directory.
Override with:
Triggers
Instead of calling save() by hand, the exporter can subscribe to simulation
events and save automatically:
field_exporter.set_trigger([
    mufem.Event.Initialization,
    mufem.Event.TimeStep,
    mufem.Event.RunCompletion,
])
Available events:
| Event | Description |
|---|---|
Initialization |
Once after the simulation initializes (initial state ready). |
TimeStep |
At the end of each time step. |
Iteration |
At the end of each inner iteration within a step. |
RunCompletion |
Once after the runner's main loop finishes. |
Triggered saves use the preconfigured order from set_order().
Saving manually
To save the current state on demand, call save():
field_exporter.save()         # uses the preconfigured order
field_exporter.save(order=2)  # overrides the order for this call
Each save() call — whether manual or driven by a trigger — appends a new
frame to the .vtpc.series collection.
Static cases typically call it once; transient or parametric studies let
triggers drive it on every step.
Activation
A configured exporter can be temporarily disabled.
While inactive, both manual save() calls and event triggers are ignored:
Re-enable with set_active(True).
Example
The script below sets up a minimal simulation with a RefinementModel,
registers a few of its built-in fields with the exporter, and writes a
single VTK snapshot:
import mufem

sim = mufem.Simulation.New(name="My Case", mesh_path="geometry.mesh")

runner = mufem.SteadyRunner(total_iterations=1)
sim.set_runner(runner)

refinement_model = mufem.RefinementModel()
sim.get_model_manager().add_model(refinement_model)

sim.initialize()

field_exporter = sim.get_field_exporter()
field_exporter.add_field_output("Cell Volume")
field_exporter.add_field_output("Position")

field_exporter.save()
After running, open VisualizationOutput/Output.vtpc.series in any of the
supported post-processors.
Two example renderings from mufem-Scenes are shown below.
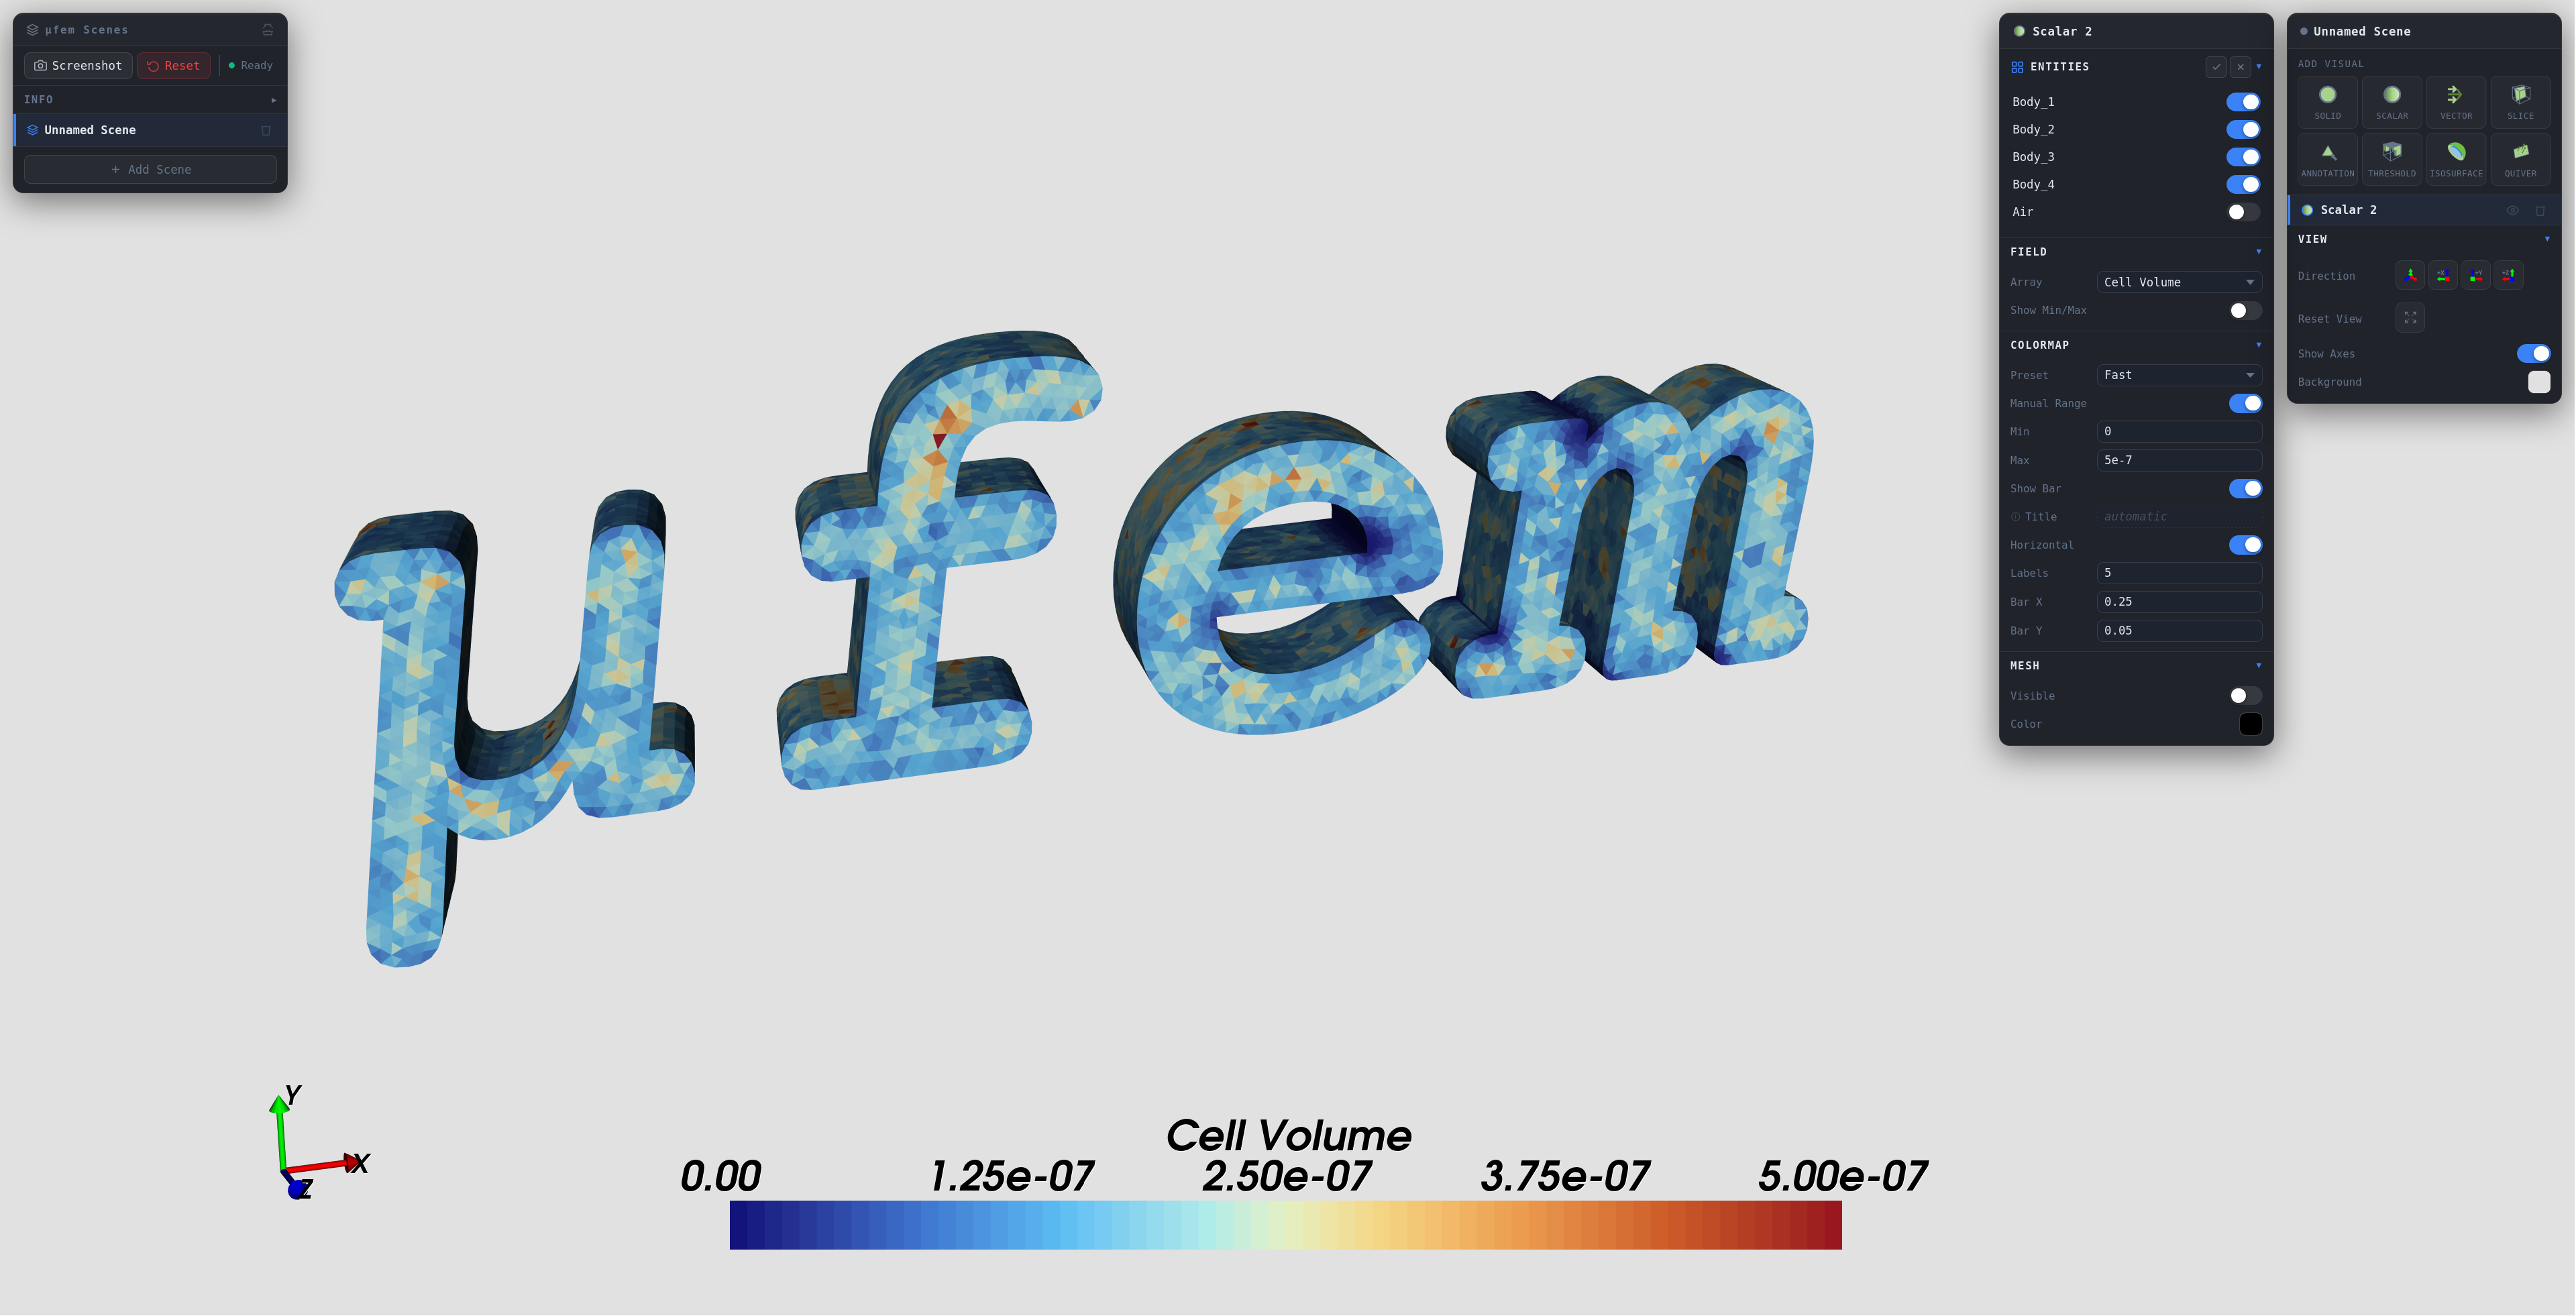
The Cell Volume field shows the distribution of cell sizes in the mesh, useful for identifying refined regions or regions of poor mesh quality. Cell volume is cell-wise constant.
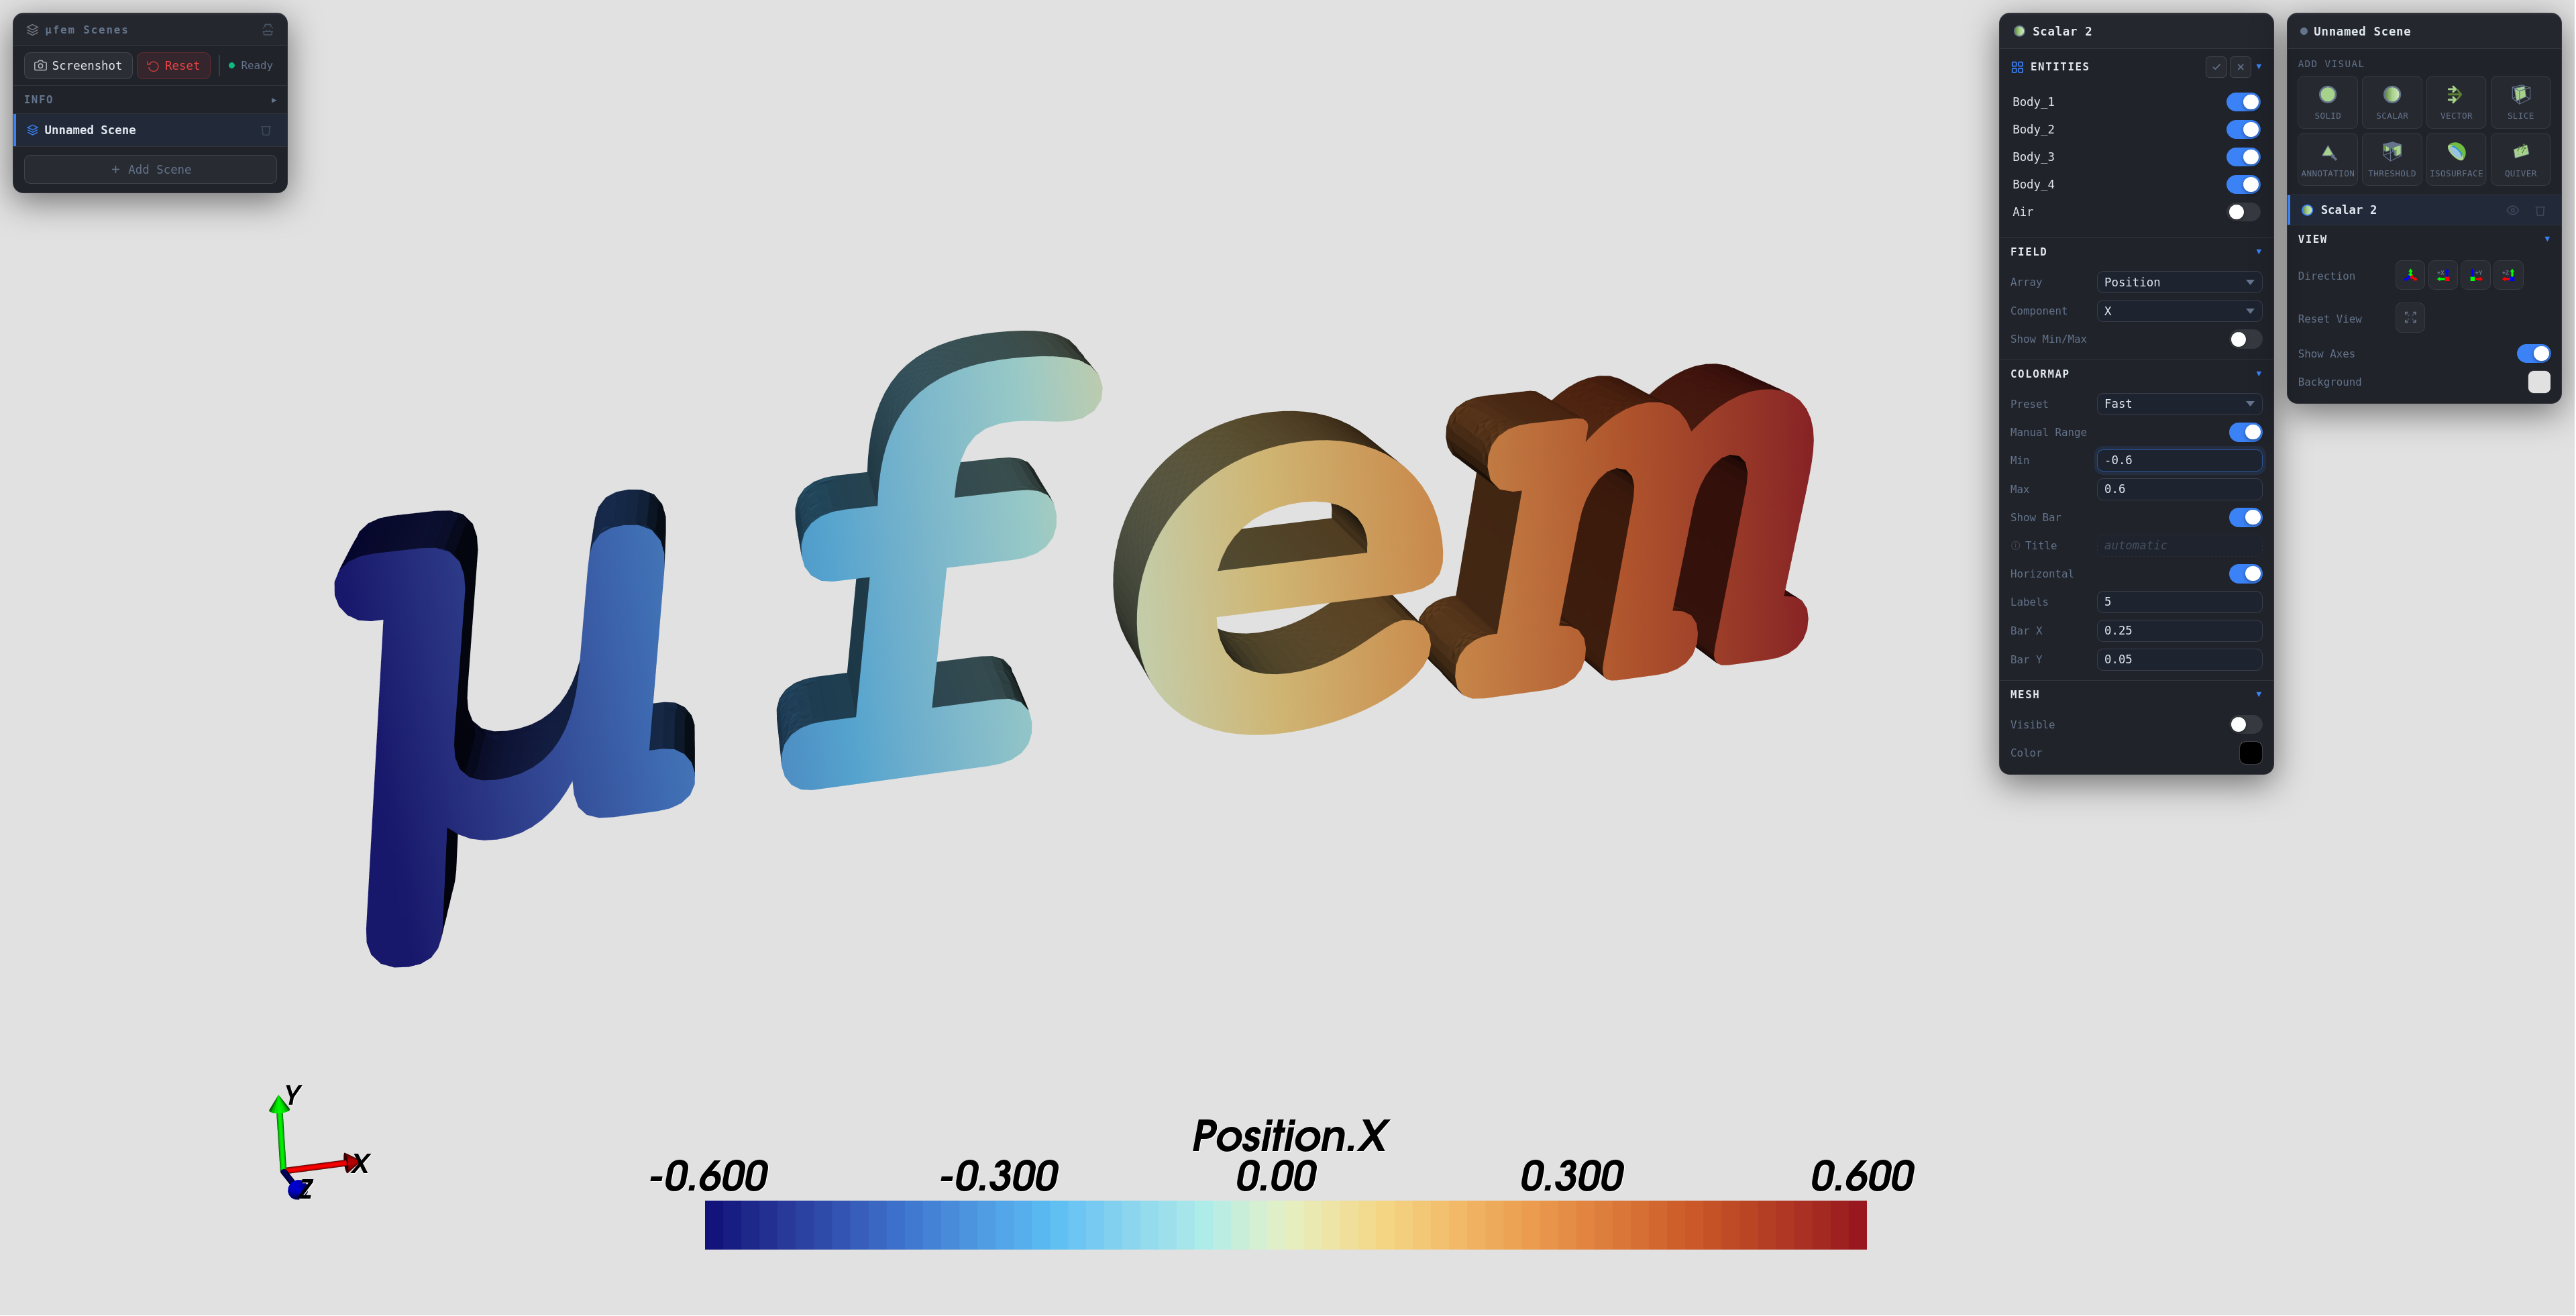
The Position field's x-component varies smoothly across each cell, illustrating that this field is not a cell-wise constant.
Viewing the Output
The Output.vtpc.series data collection produced by the exporter can be
opened in any VTK-compatible post-processor.
Two options are described below.
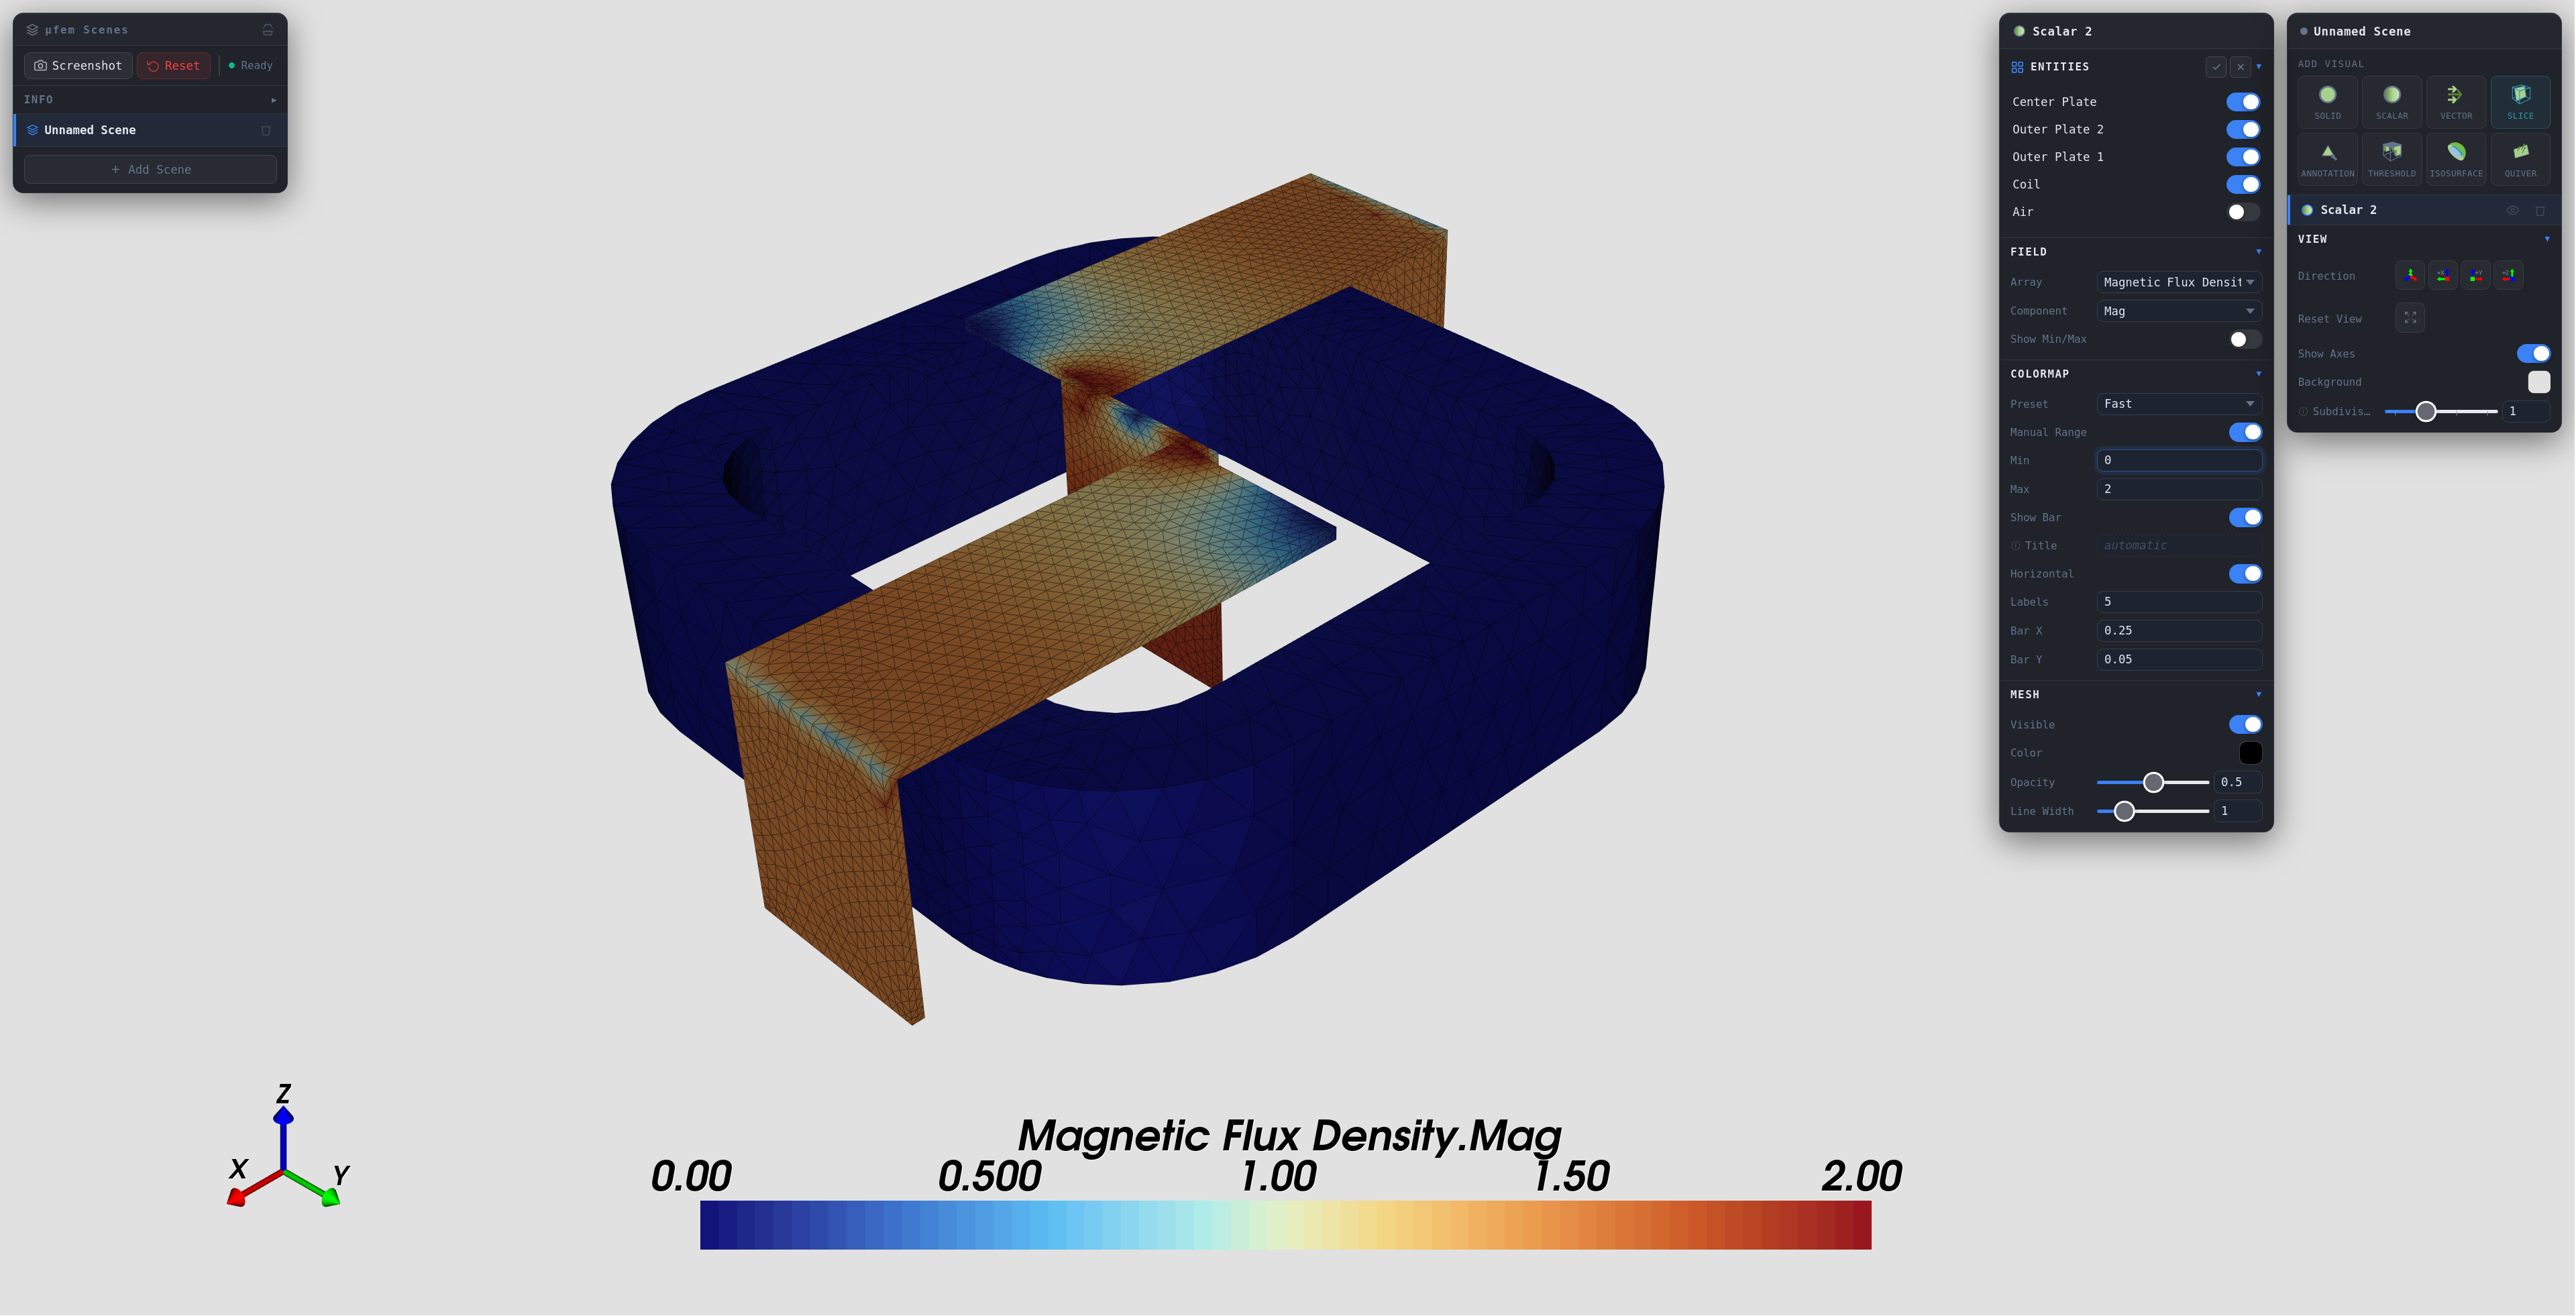
mufem-Scenes
mufem-Scenes is μfem's own
post-processor, available directly in the browser — no installation required.
Open the link and load the Output.vtpc.series file from your output directory
to inspect the exported fields.
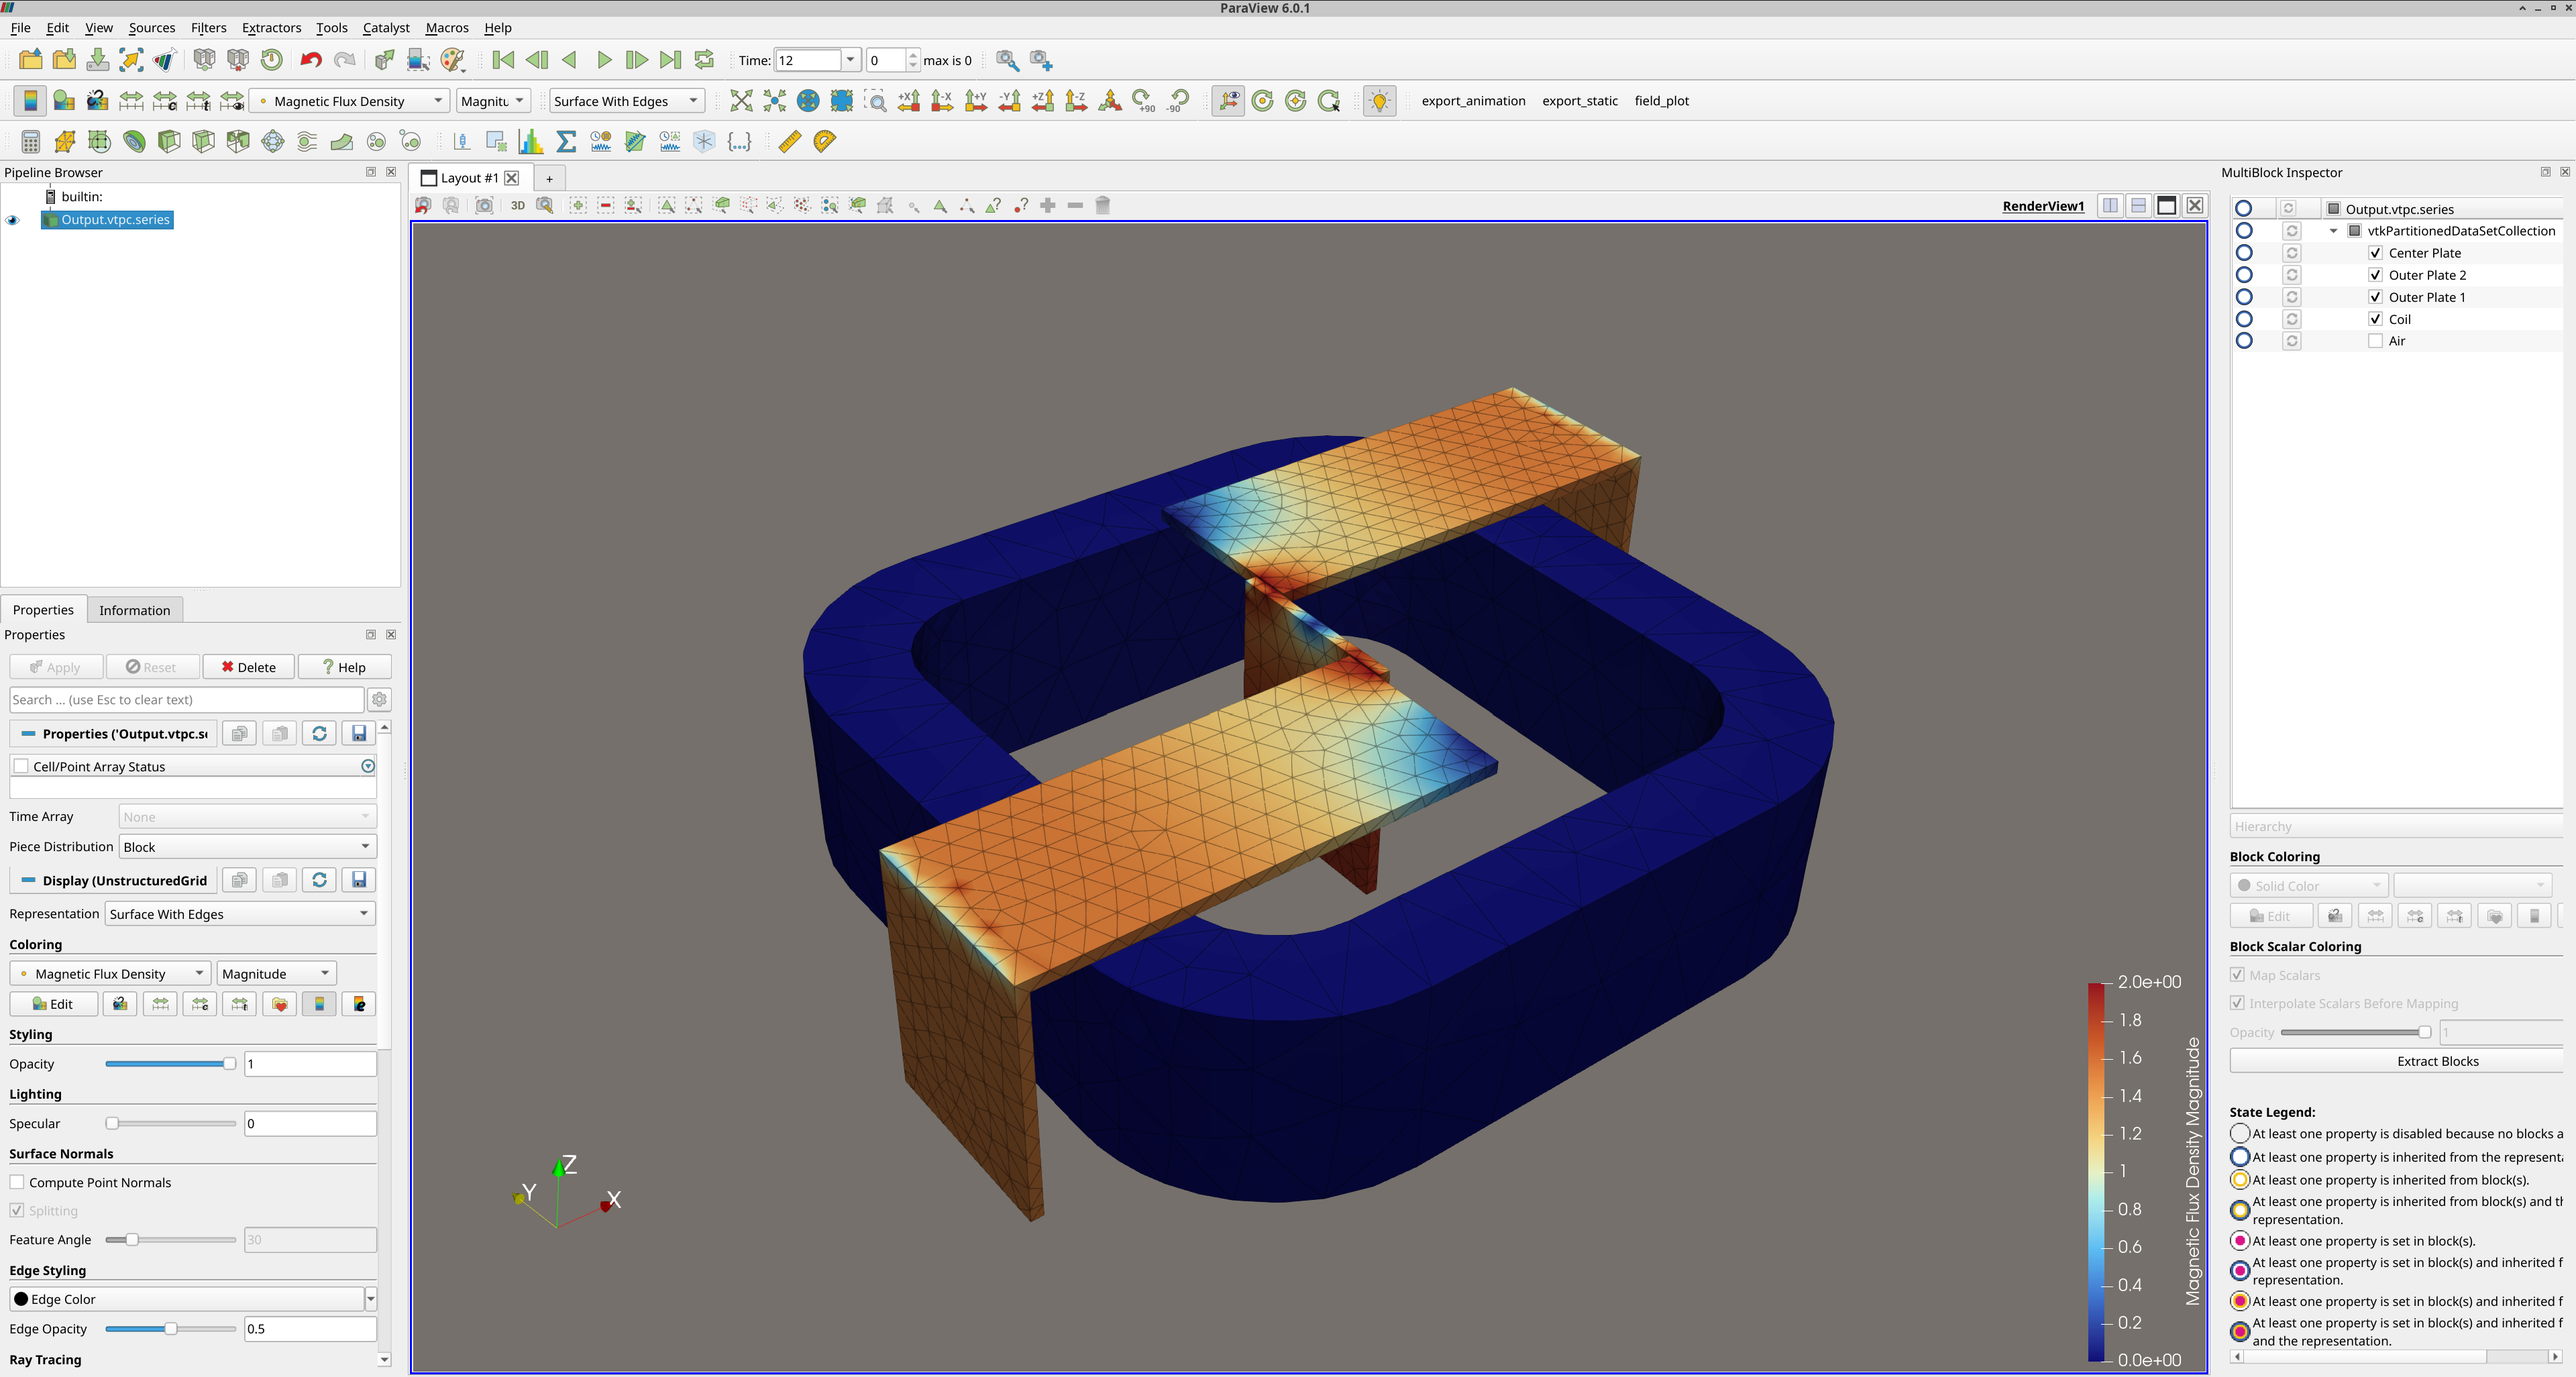
ParaView
After installing ParaView, open the data collection from a terminal:
or via File → Open from the GUI.